CompletedAug – Sep 2026Solo project
not-strangers: Catching Coordinated Payment Fraud
Payment fraud rarely happens one transaction at a time. not-strangers resolves card transactions into persistent client identities, links the identities that share a device, an address and email, or a card profile, and scores the clusters they form. Built on the IEEE-CIS fraud dataset, with an ablation that reports where the lift really comes from.
- PR-AUC over a transaction-only baseline (0.565 → 0.632)
- +0.068
- PR-AUC over a transaction-only baseline (0.565 → 0.632)
- fraud cost per 10k transactions
- -13%
- fraud cost per 10k transactions
- real transactions, split by time
- 590k
- real transactions, split by time
- ungrounded numbers across 30 LLM explanations
- 0
- ungrounded numbers across 30 LLM explanations
The problem
Most fraud models score each transaction on its own: the amount, the time, the device, the card. But organised payment abuse is a group activity. One operator runs many cards from one phone. A fraud ring reuses the same delivery address with a handful of email accounts. Looked at one by one, each of those transactions can look ordinary.
The question I wanted to answer: if you first work out which transactions belong to the same client, and then which clients are connected to each other, do the clusters carry a fraud signal that single transactions don't? And just as important, how much of any improvement is real?
How it works
The pipeline runs on the IEEE-CIS fraud dataset: about 590,000 real card-not-present transactions, split by time (472,432 for training, 118,108 held out), so the model never learns from the future.
- Resolve identities. Transactions are grouped into persistent client identities (
uid) from card, address and account-age fields, since the dataset has no customer id. - Build the entity graph. Two identities are linked when they share a device fingerprint, an address code together with an email domain, or a card-issuer profile together with an address. A hub guard drops values shared by too many identities ("Windows", "gmail.com"), because a common default is not evidence of a relationship.
- Compute cluster features. For each connected group: features such as its size and the share of members with earlier fraud history. Every feature only uses transactions from before the moment being scored.
- Compare two models. A LightGBM model on transaction features alone, and the same model with the cluster features added, with identical hyperparameters.
- Decide, then explain. A policy layer turns a score into
allow,step_uporreviewusing fixed, cost-derived thresholds. Separately, an LLM writes a plain-English summary of a cluster for the analyst.
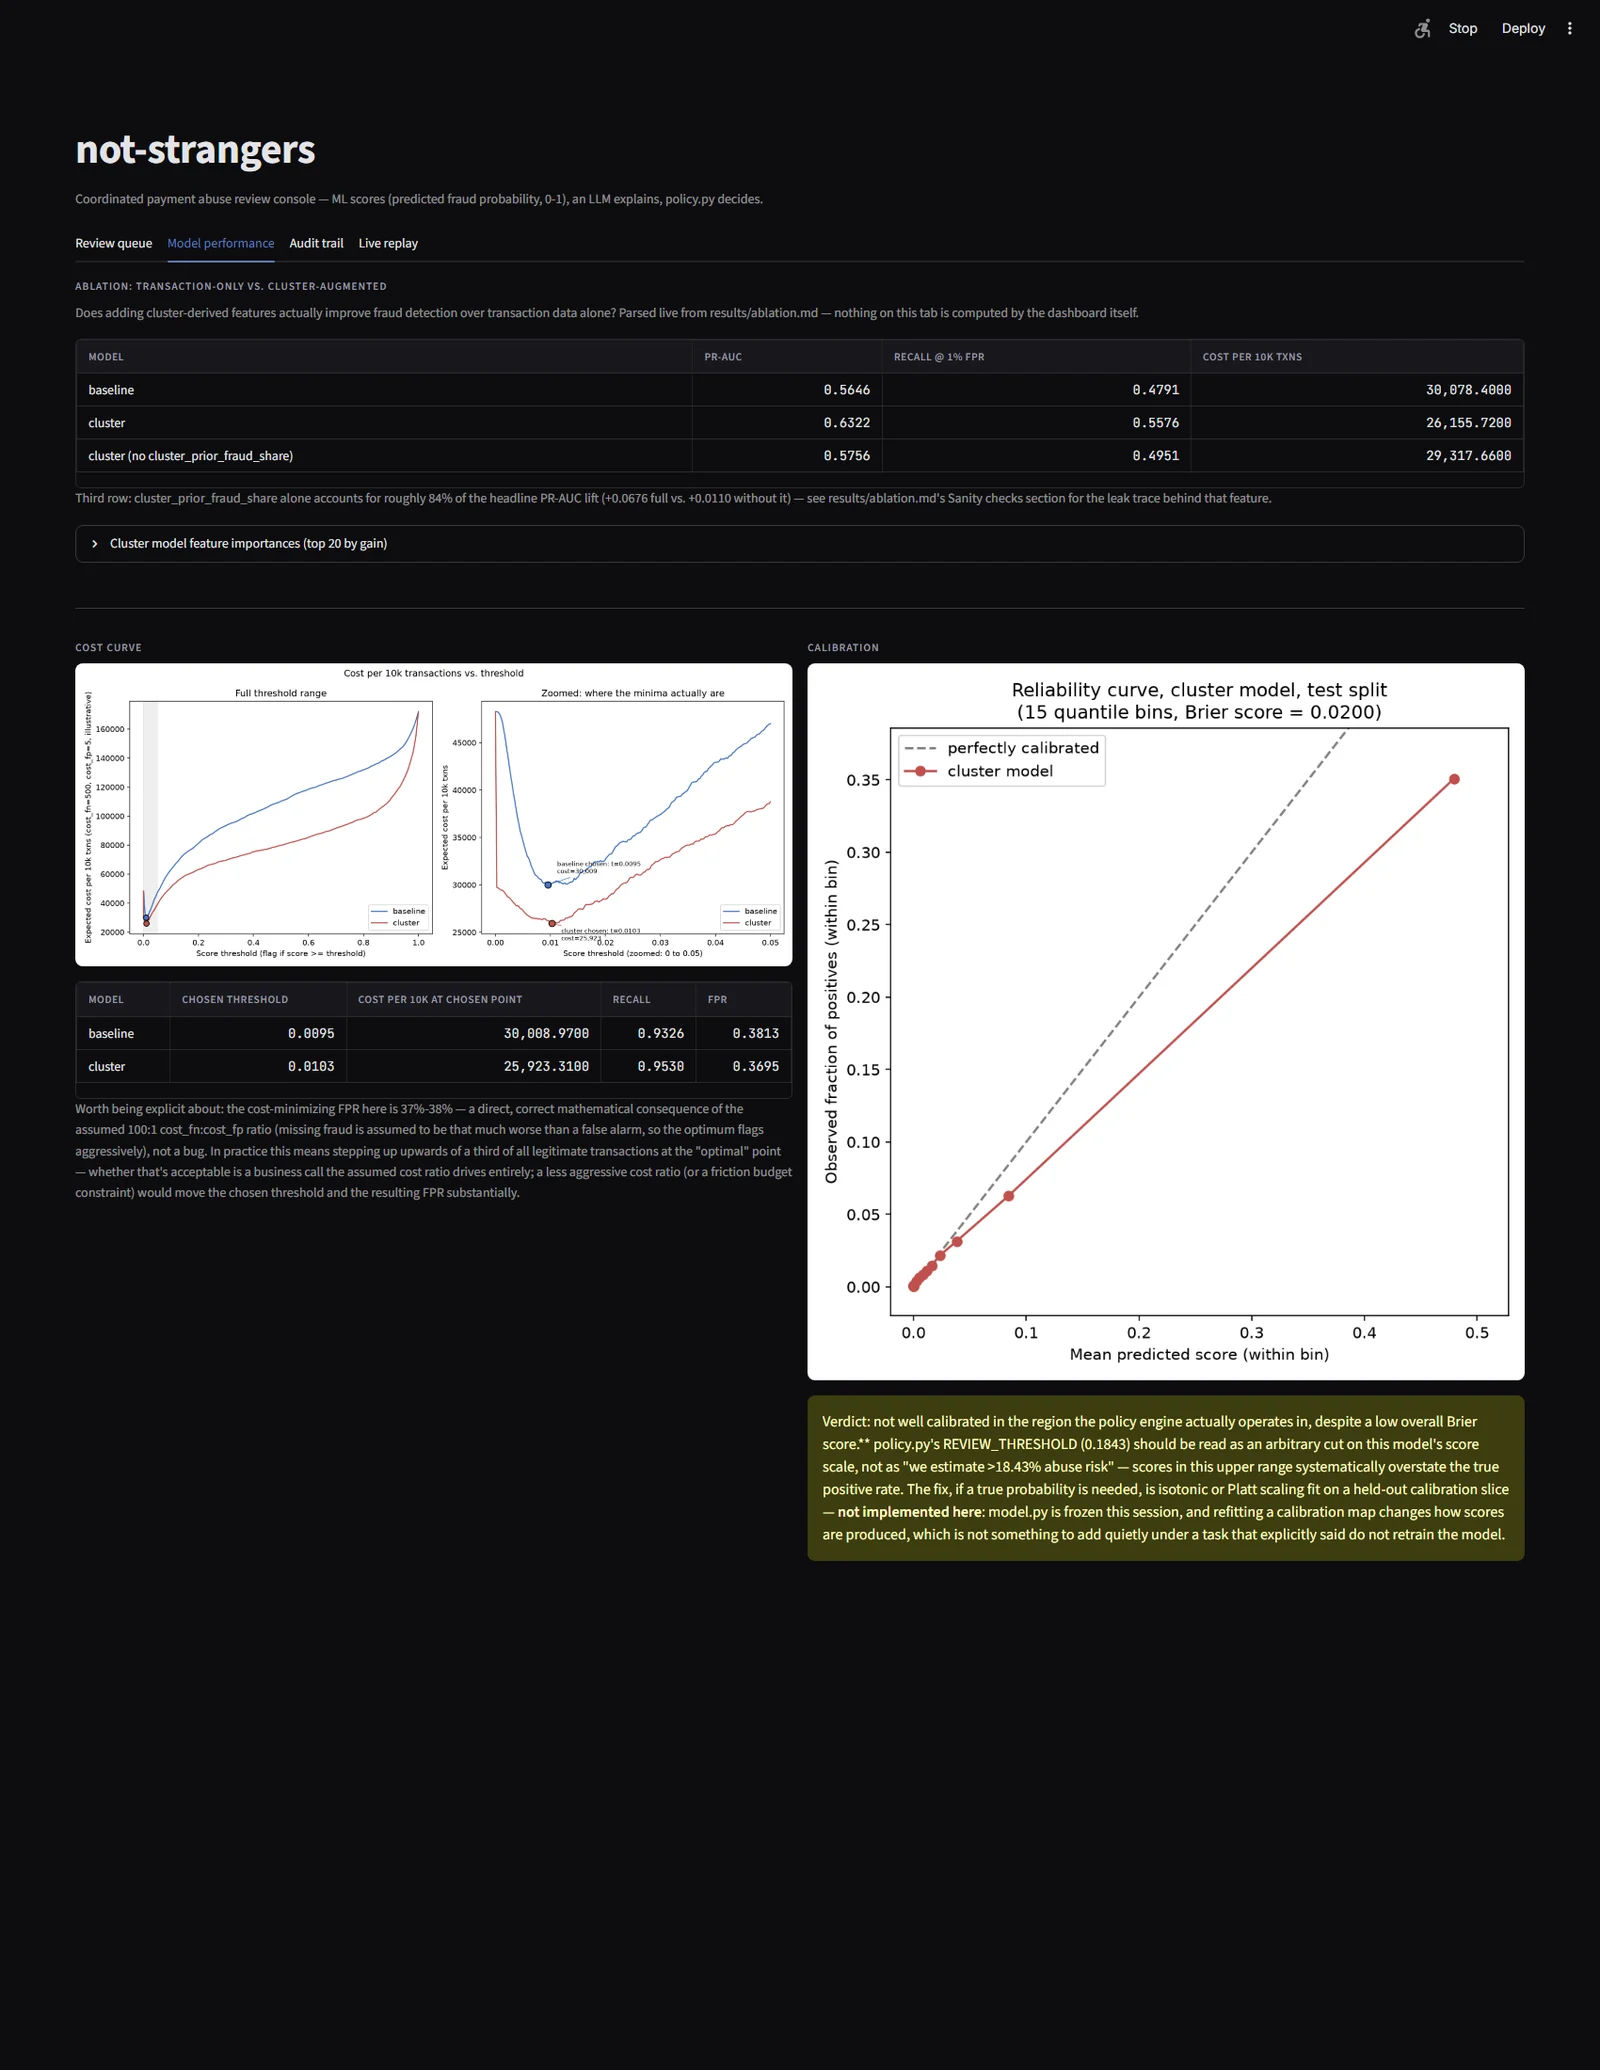 Model performance: the ablation table, feature importances, cost curve and calibration
Results, honestly
| Model | PR-AUC | Recall at 1% false-positive rate | Cost per 10k transactions |
|---|---|---|---|
| Transaction features only | 0.5646 | 0.4791 | 30,078 |
| + cluster features | 0.6322 | 0.5576 | 26,156 |
| + cluster features, minus prior fraud share | 0.5756 | 0.4951 | 29,318 |
The cluster model lifts PR-AUC by 0.068 and cuts the modelled fraud cost by about 13%. The third row is the important one. About 84% of that lift comes from a single feature: the share of a cluster's members that already had fraud. Without it, the gain shrinks to +0.011.
I checked that feature for leakage across all 155,579 clusters by recomputing it straight from the raw rows, bypassing the pipeline, and found no mismatches. So the lift is real, but it mostly says "fraud history spreads through connected identities", not that the graph discovers new rings on its own. Across four rolling time splits the full lift holds (mean +0.052); the residual without that feature does not. I'd rather report that than a single flattering number.
The analyst console
A Streamlit console puts the model's reasoning in front of an investigator. For each cluster it shows the entity graph, with edge colours for the linkage rule that connected each pair, and the SHAP breakdown of the decision, split between transaction-level and cluster-level features.
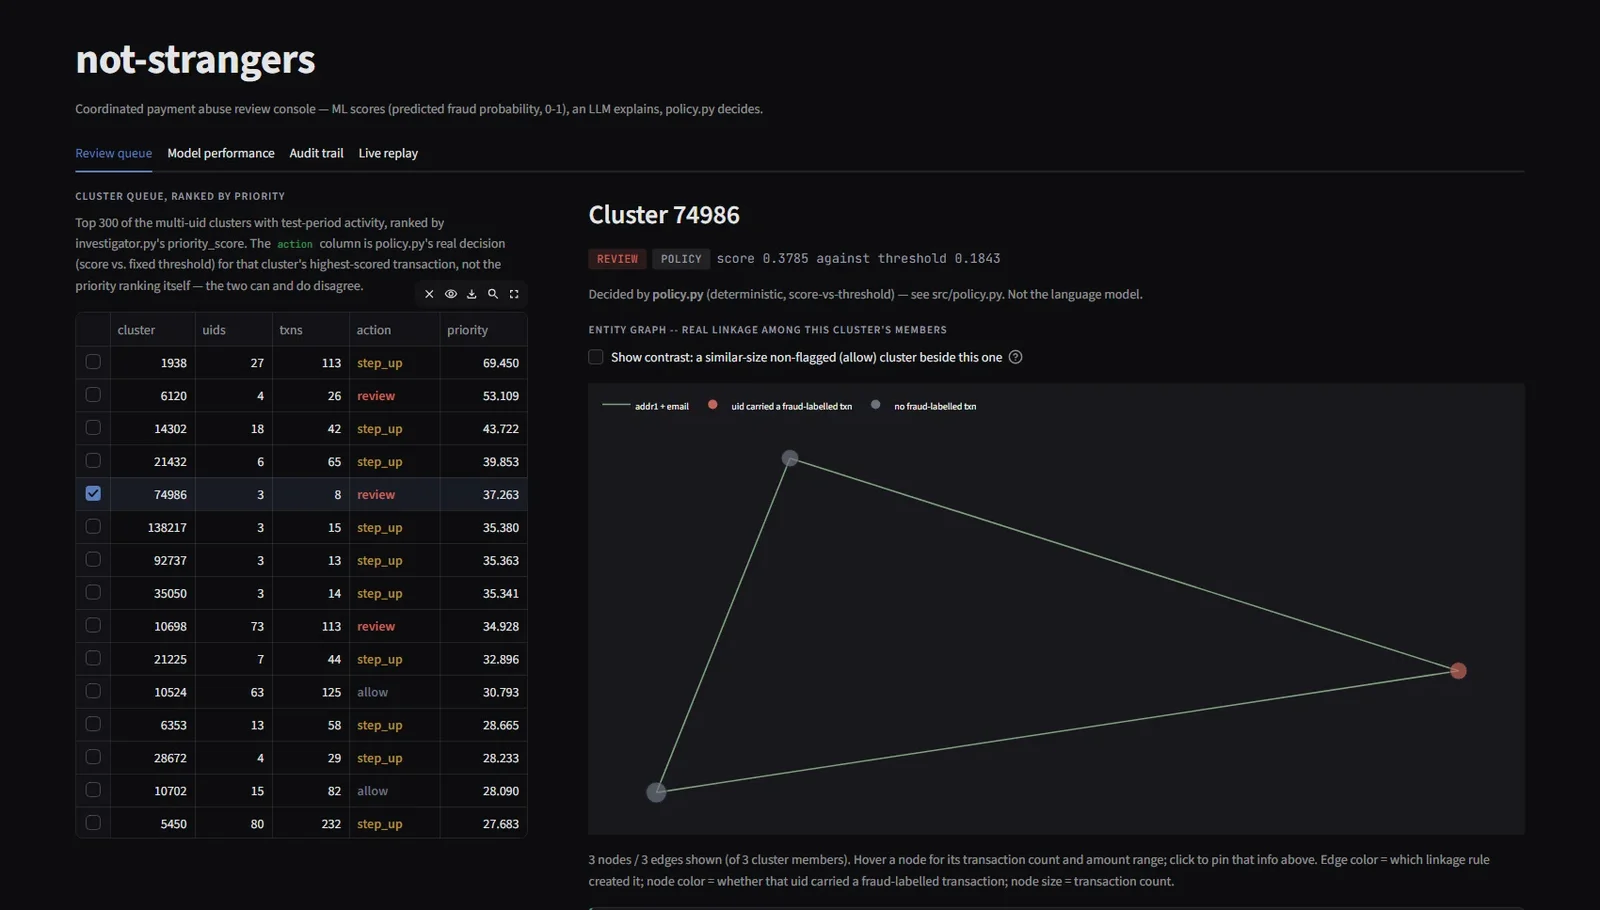 Cluster detail: three identities, each linked to the others by a shared address and email domain
Below the graph sits the LLM narrative, labelled with its source. Every number it states is checked against the evidence it was given; on the evaluation run, none of the numeric claims across 30 explanations were ungrounded. The narrative never touches the decision.
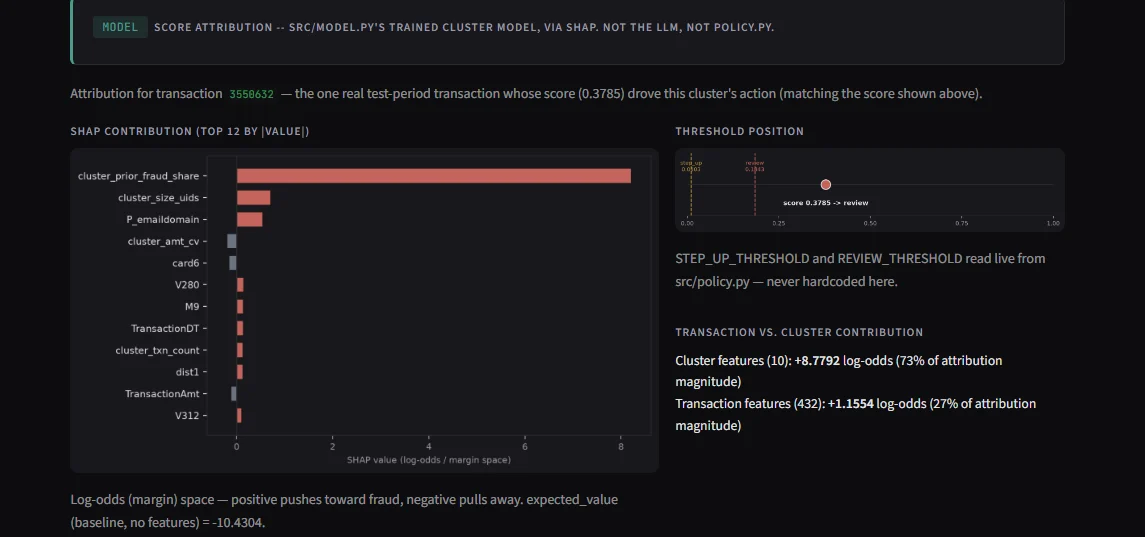 SHAP attribution for a cluster, with the LLM narrative beneath it
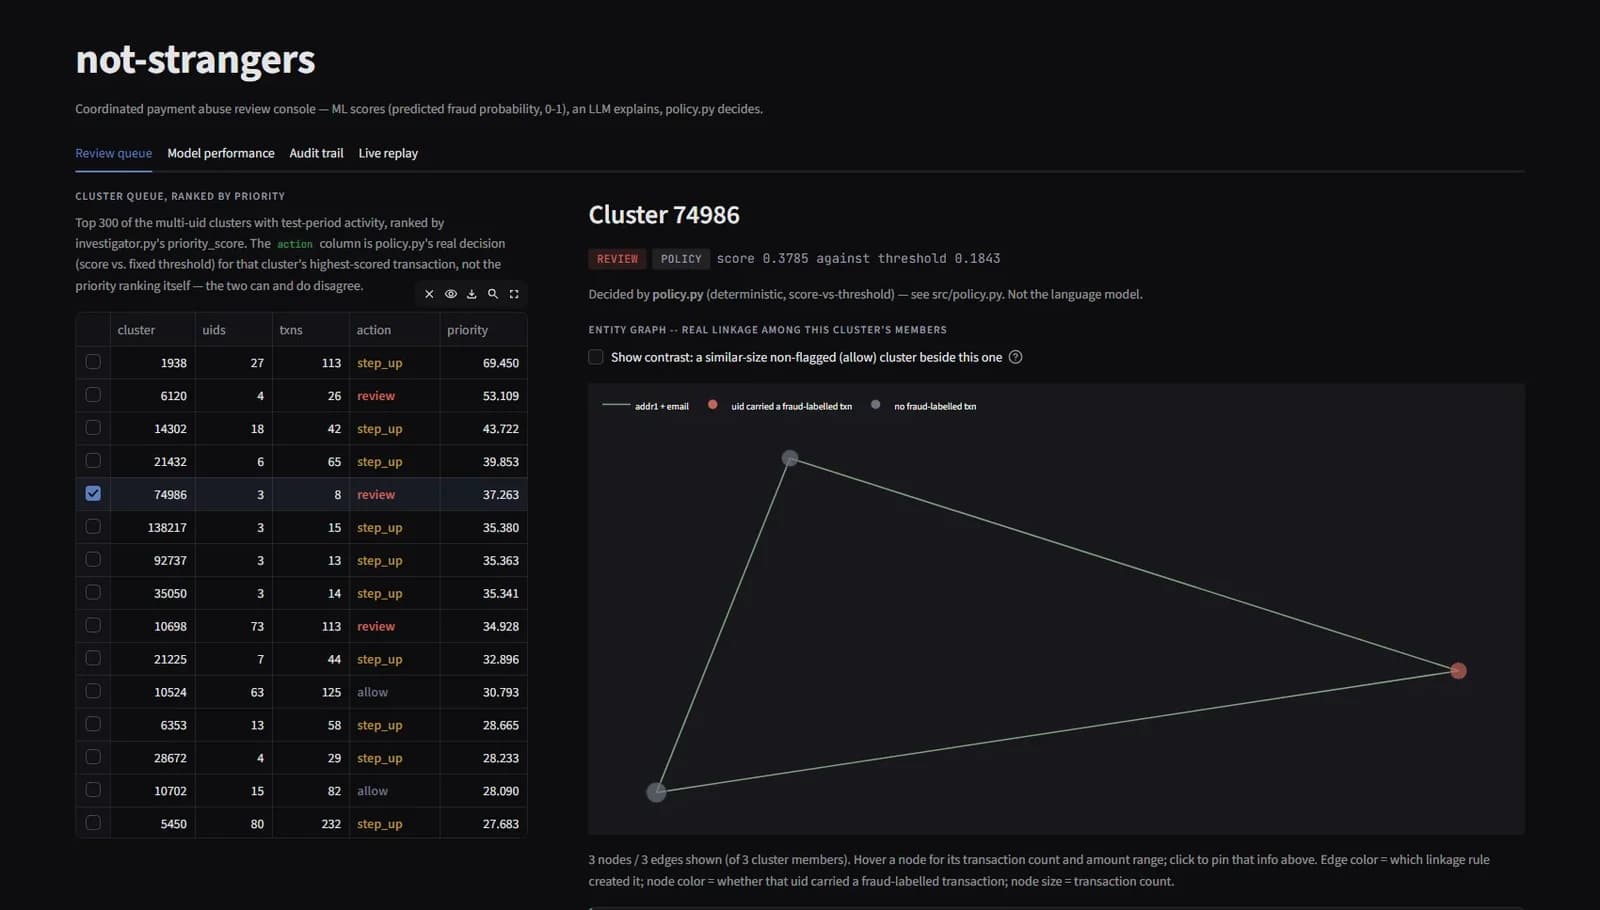
There is also a review queue that ranks clusters for investigation, and a live replay that runs real held-out transactions through the pipeline in timestamp order, building the graph as identities transact.
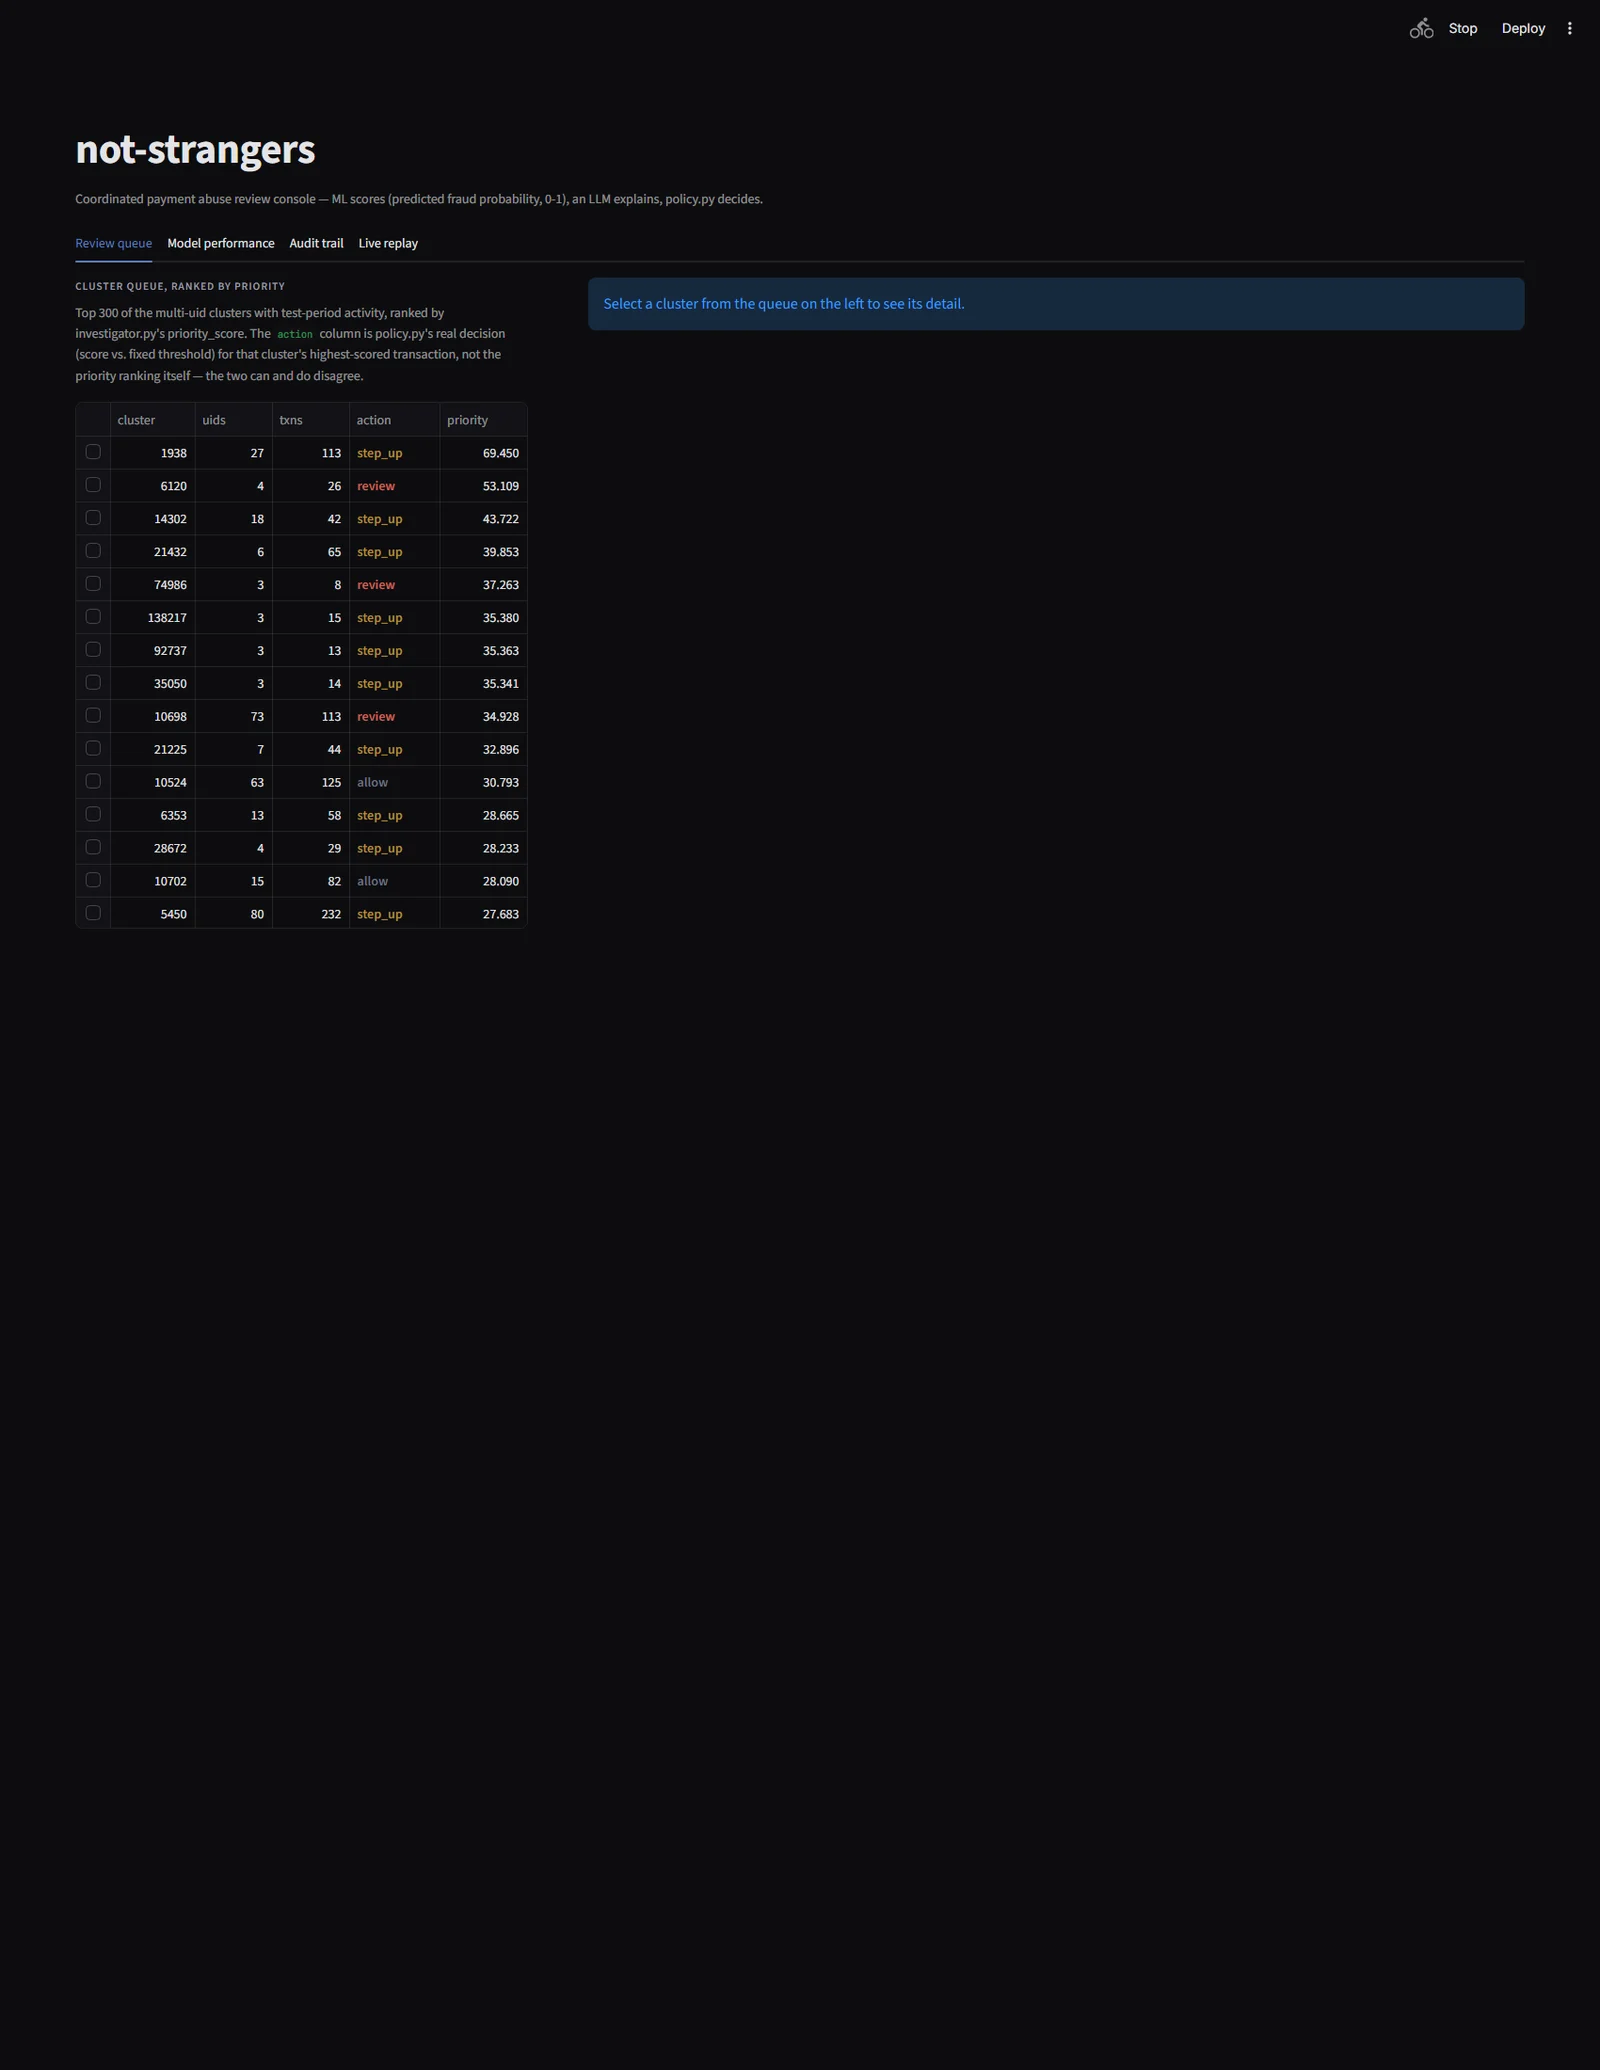 The review queue, ranked by priority, with the policy's actual decision alongside
Engineering decisions
- The model decides; the LLM only explains. The policy module has no import of the LLM module, and that is checked both statically and by a behavioural test. A decision can never depend on generated text.
- The evaluation code is frozen. Metrics are computed by a module that was never edited to improve a number.
- No future data. Graph features for a transaction only see transactions before it, and a dedicated test checks that test-period labels can't leak in.
- Batch versus inline, measured. Building the graph and its cluster features for the full training set takes about 26 seconds and runs as a batch job; scoring a single transaction takes about 52 ms at p50. Each has its own budget.
- Tested. Unit tests cover identity resolution, graph building, the model, the policy and the evaluation metrics.
Limitations
- The strongest feature is backward-looking. It measures how fraud labels propagate across connected identities, which this dataset rewards because a chargeback marks a card's whole history.
- Identity resolution over-merges: 10 of the 20 largest identities mix more than one real client.
- About 11% of transactions get no identity at all, and that slice has the highest fraud rate (11.6% versus 2.5%).
- The dataset has no "real fraud ring" labels, so everything reported is feature lift, not ring-detection accuracy.
- The model is overconfident in the highest-score bin, exactly where the policy acts, so the review threshold should be read as a cut-off rather than a probability.
Mapping to Indian payments
The features here are IEEE-CIS card-network columns. In an Indian payments stack the closest analogues would be a tokenised payment instrument for the card, an SDK device fingerprint for the device, a pincode for the address code, and the customer's contact identity for the email domain, with new signals such as the UPI handle and the PSP. UPI also has no chargebacks, so the labels would have to come from somewhere else, such as merchant-reported fraud or return-abuse signals, each with its own delay and noise to measure.