Insider Threat Detection Dashboard
Project Overview
Insider threats are notoriously difficult to detect because they look like legitimate user activity.
This project demonstrates an end-to-end analytical workflow—from raw log processing to statistical modeling—culminating in an interactive Power BI dashboard.
By analyzing user behavior logs (Logons, USB activity, File transfers), I built a Python-based risk-scoring engine that identifies behavioral anomalies, filtering out 99% of "normal" noise to find the 1% of malicious actors.
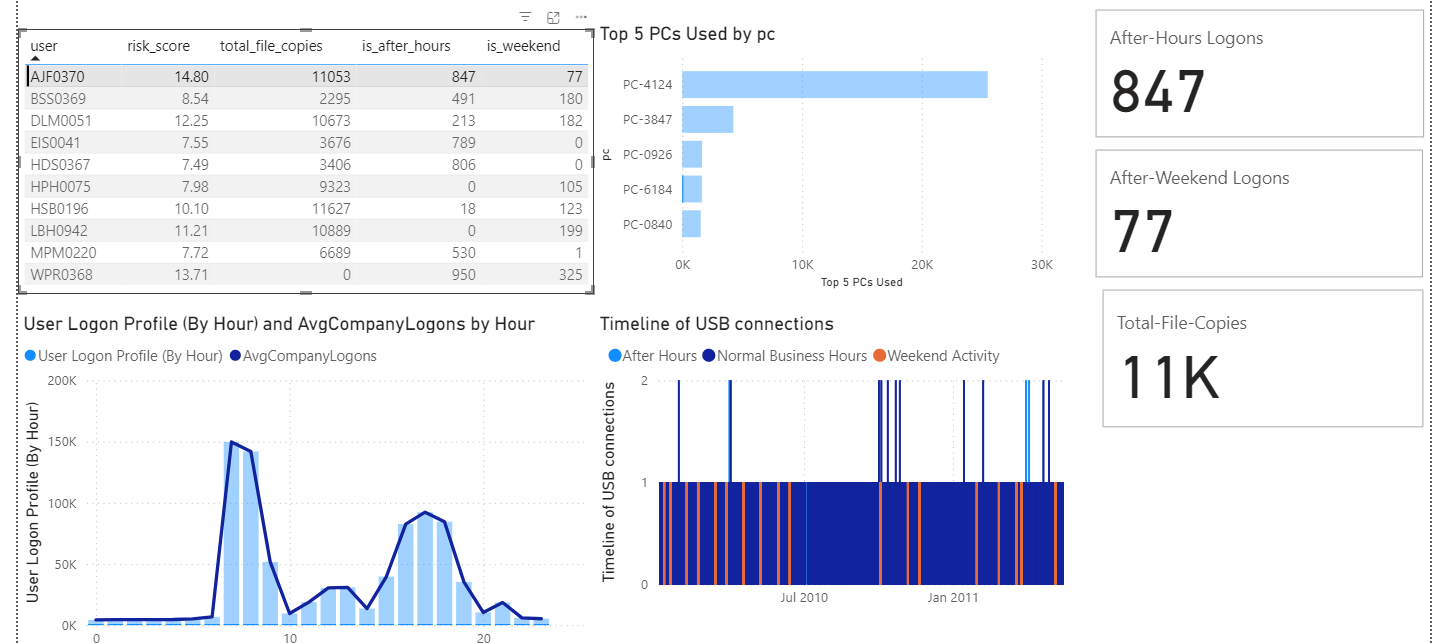
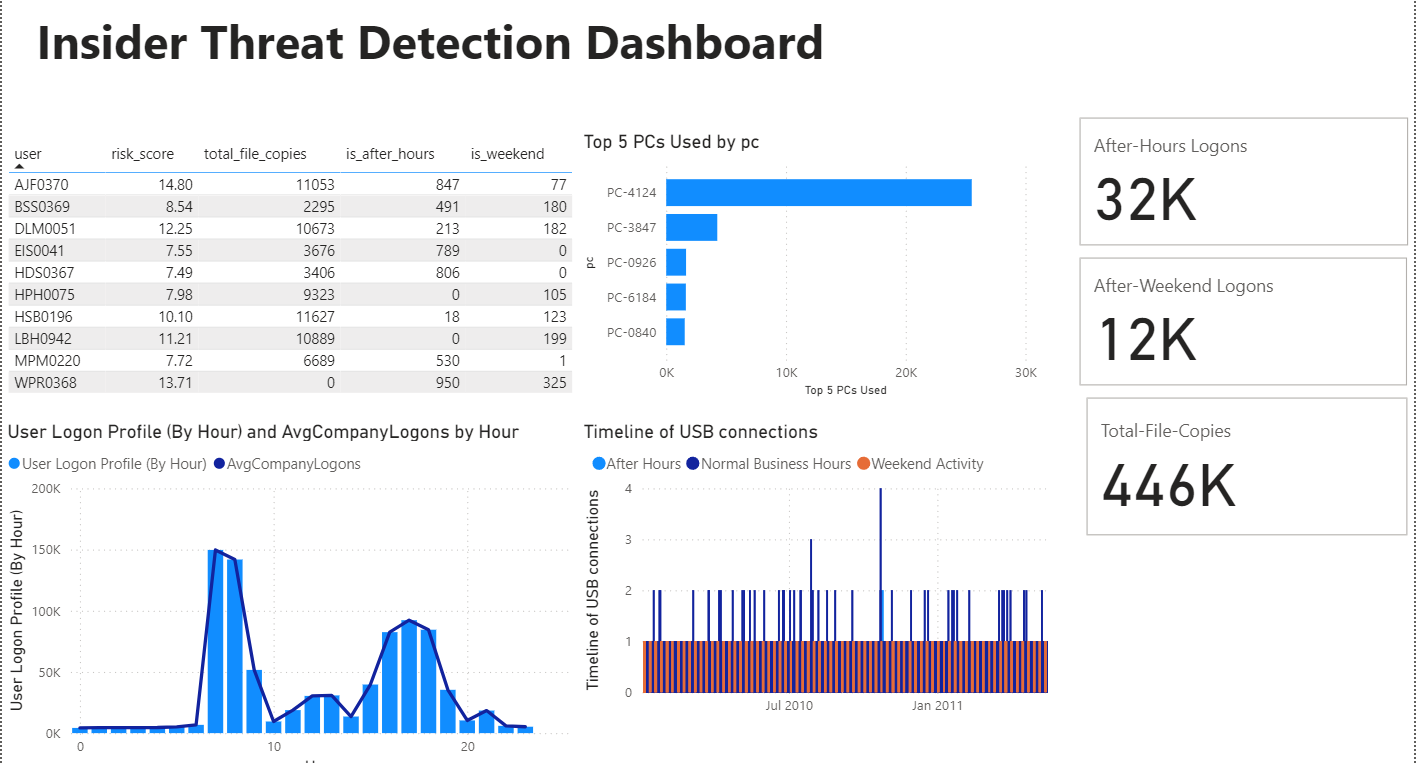 Final SOC Dashboard highlighting top risk users
The Analytical Workflow
This project followed a structured, multi-stage data science lifecycle:
1. Exploratory Data Analysis (EDA)
Before detecting anomalies, I first had to define "normal." Using Python and Pandas, I processed the CERT Insider Threat Dataset (>5GB) to visualize corporate-wide login patterns.
The resulting heatmap clearly identified the standard 7 AM - 6 PM workday, providing the baseline required to flag after-hours anomalies.
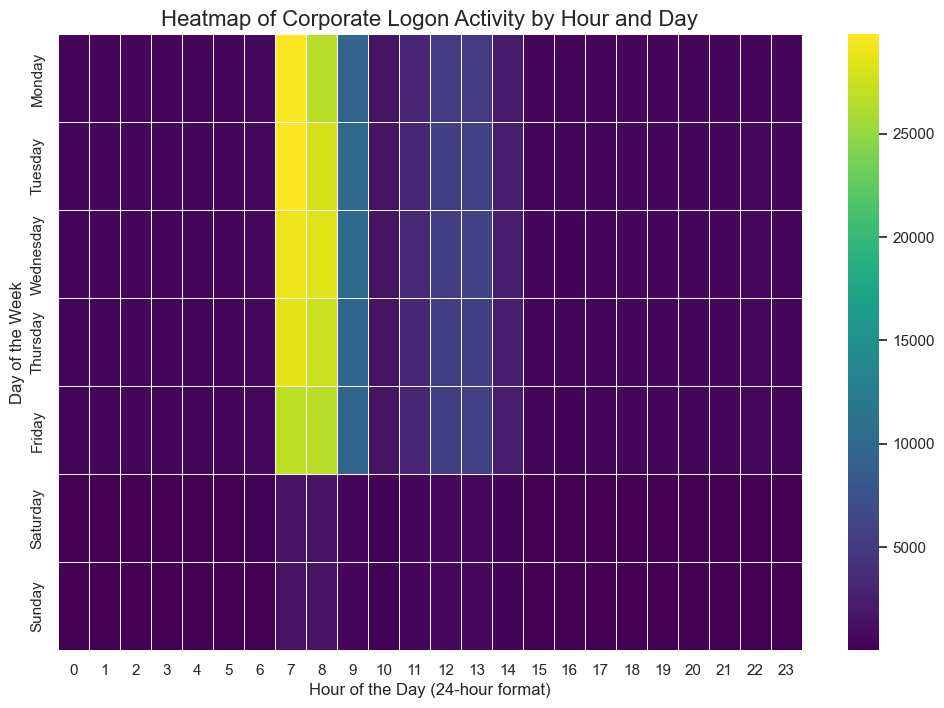 Heatmap showing normal logon patterns
2. The Risk-Scoring Engine
I engineered a composite risk score for all 1,000 users. Instead of relying on simple counts (which generate false positives), I calculated Z-scores (Standard Deviations from the mean) for three key indicators:
- Total volume of file copies.
- Total number of after-hours logons.
- Total number of weekend logons.
This statistical approach automatically bubbled the most suspicious users to the top of the list.
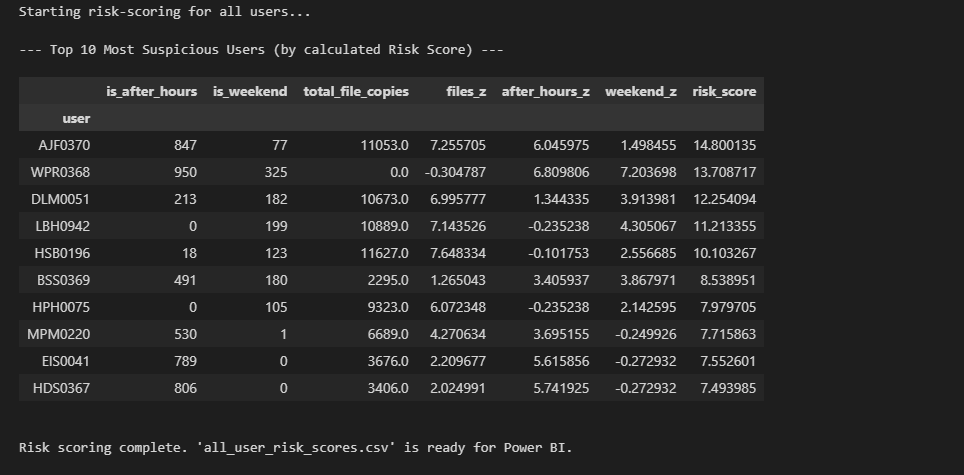 Ranked list of suspects with Risk Scores
Dashboard Architecture
The processed data and risk scores were ingested into Power BI. I constructed a Star Schema data model to allow for rapid, drill-down capabilities between the high-level risk scores and the granular event logs.
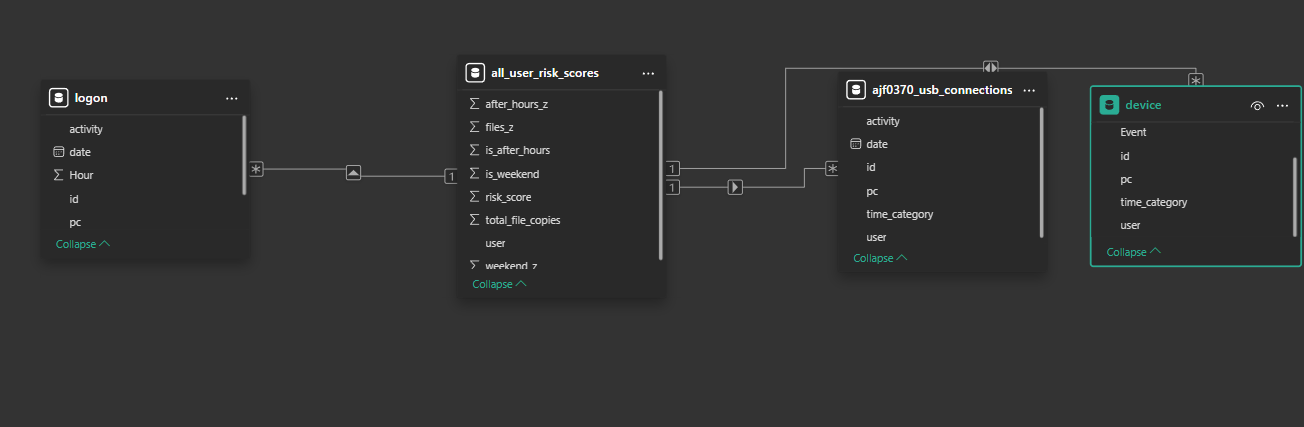 Power BI Data Model (Star Schema)
The Investigation (Findings)
The analysis successfully differentiated between "Automated Anomalies" and "Human Threats."
The False Positive:
User HSB0196 had the highest file volume. However, the dashboard revealed machine-like, perfectly periodic logon patterns, indicating a scheduled backup script rather than a human threat.
The True Threat:
User AJF0370 had the highest composite Risk Score. The dashboard drill-down confirmed a clear pattern of working late at night and on weekends, correlating directly with high-volume USB exfiltration events.
 Filtered investigation view of the primary suspect
Technical Stack
| Component | Technology Used |
|---|---|
| Data Processing | Python, Pandas, Jupyter Notebook |
| Visualization | Microsoft Power BI, DAX |
| ETL | Power Query |
| Math | Z-Score Statistical Modeling |
Reproduction Steps
-
Clone the repository:
git clone https://github.com/sohankanna/Insider-Threat-Detection-Dashboard.git -
Data Setup: Download the CERT Insider Threat Dataset (r4.2) and place the
.csvfiles inside adata/folder. -
Run Analysis: Execute
insider_threat_analysis.ipynbto generate the risk scores. -
Visualize: Open
Insider_Threat_Dashboard.pbixand refresh the data source to point to your local processed files.